Crowd Insights - How it works

Local Insights built on local data
We own and operate the largest digital infrastructure in the Nordics and Baltics. This is what generates the data for Telia Crowd Insights. With 30-40% population coverage in most of our markets, it gives us a dataset we can accurately extrapolate to the whole population. This provides accurate, measurement-based data and meaningful, location-specific insights.
We deliver data daily (with a 36-hour delay as part of the anonymization process). We can also deliver data going back two years or more, so you can understand patterns and trends.

Mobile devices constantly generate movement data in our network. Each device will generate up to 200-400 data points per day, depending on how active the user is.
We divide our network into geographical areas large enough to ensure that individuals cannot be identified. We then irreversibly anonymise the data before aggregating and extracting it as crowd data.
We analyze the crowd movement between different parts of the city: for example where people commute to and from each day. We also analyse the crowd density in different parts of the city at different times of the day
This gives useful insights into the way crowds move. For example helping city planners and public transport operators to optimise existing services and create new ones.
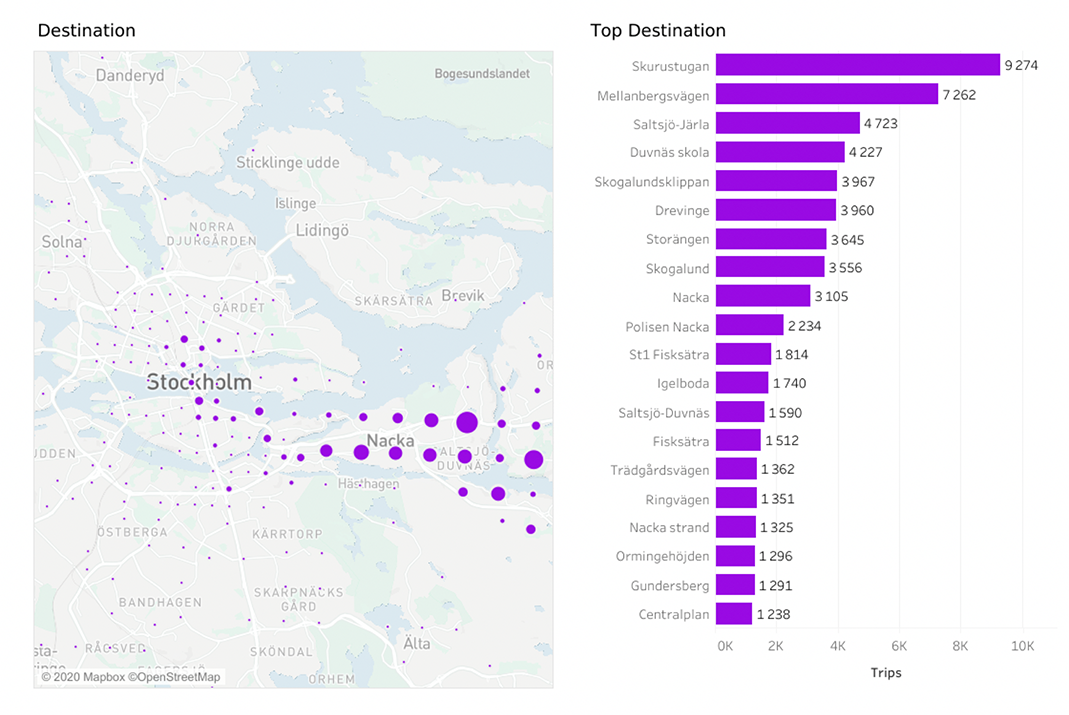
Origin > Destination
Origin-Destination Matrix (ODM) reports show where people come from, where they go to, and how they move throughout the region or country. Understanding how people travel each day lets transport operators and urban planners make better-informed decisions.
- Identify new public transportation routes to match unmet needs
- Reduce commute and connection times
- Understand changes in movement behaviour and measure the impact of infrastructure improvements or recommendations
- Reduce operating costs by matching services and staffing to current needs
![]()
Routing reports
Routing Reports give deep insight into trip routes and transport choices.
- Understand where to situate public facilities such as car parking, food kiosks and bicycle stands
- Identify congestion at transit points and take steps to improve the commuting experience
- Understand crowd flow to large-scale events, including when and how people get there
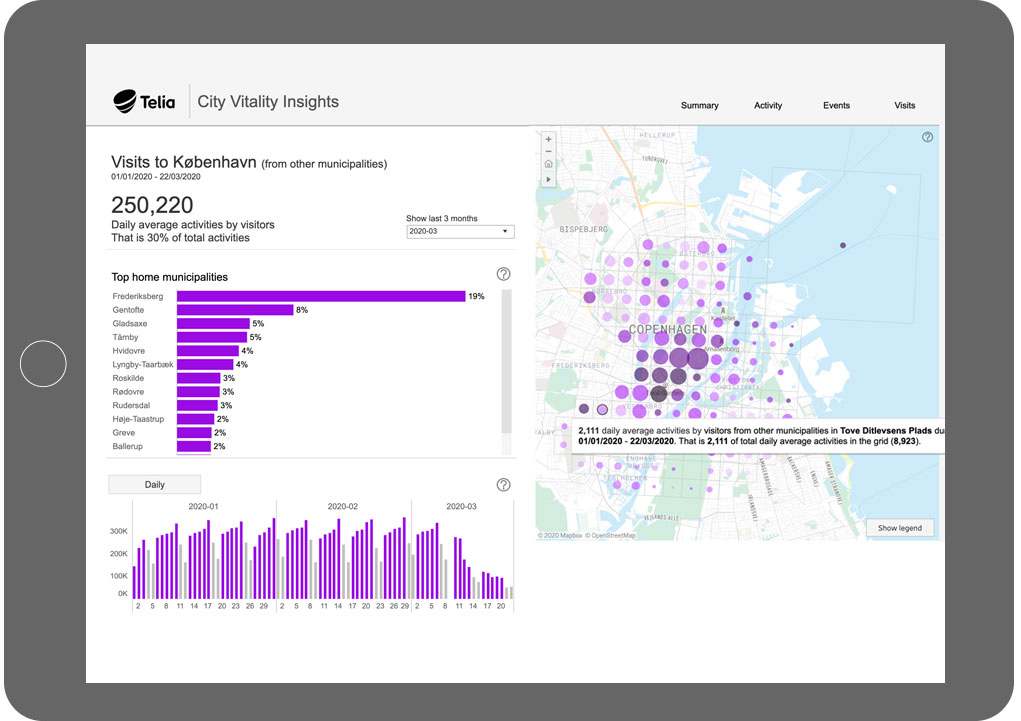
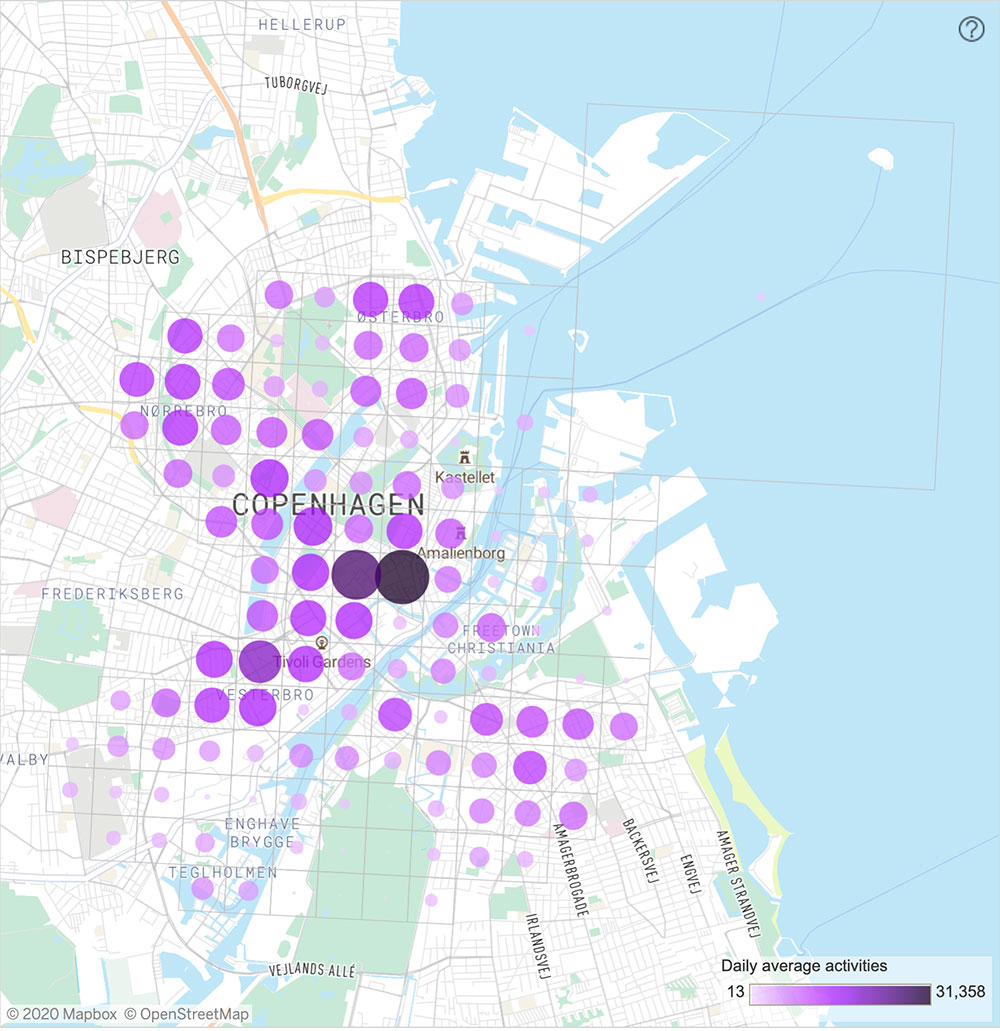
Activity reports
Activity Reports reveal when people arrive, where they come from, and where they go next. They show where people congregate during working hours, at weekends and at night.
The size of the circle in each grid indicates how many people were in each section at the time of measurement.
Crowd movement patterns
Movement patterns reveal behaviour patterns. By understanding where people spend their time and money, you can unlock new ways to give them a better experience: as shoppers, as commuters, as visitors and as residents.
It’s always anonymous and GDPR compliant – we won’t compromize on that. By anonymizing and aggregating data we can deliver rich crowd movement patterns on a country, city, suburb and street level.
![]()
Data Accuracy
Our data set is 16 million customers across the Nordics. Each of them generates more than 400 signalling events a day as their phones move between cell towers. This gives us billions of data points every day with real-world accuracy.
Because we use data from our own cellular network, we can deliver data that is representative of populations with extremely high statistical confidence. Our data is accountable, explainable and transparent.
Get in touch
Want to know more about Crowd Insights? Have a question or want to book a demo?
Don't hesitate to reach out by clicking "Talk to us" and choose "Crowd Insights" in the drop-down-menu. Fill in your details and we will get back to you as soon as possible.

Cookie notification
Cookies allow us to optimize your use of our website. We also use third-parties cookies for advertising and analytics. Please read our Cookie Policy for more information.